K6
Performance testing
K6 is an industry-leading tool for high-performance, load, and stress testing, designed to ensure your web applications and APIs can handle real-world traffic. This page shows how I help you integrate K6 into your workflows, building performance testing frameworks that align with your CI/CD pipelines and surface bottlenecks long before they hit production.
What is K6?
K6 is an open-source tool designed for high-performance load testing of APIs and web applications. It enables easy scripting in JavaScript to simulate traffic and assess system behaviour under stress, and integrates seamlessly into local and cloud environments for flexible performance testing.
With my expertise, I help you implement K6 to ensure your systems handle real-world traffic efficiently — turning performance from a release-week panic into a continuous engineering practice.
Why choose K6?
Built for serious load
Tens of thousands of virtual users from a single binary, written in Go for raw throughput. Local, cluster, or cloud — your choice.
First-class in CI
Thresholds become pass/fail gates. K6 fits into the same pipeline as your unit and e2e tests — performance stops being a once-a-quarter exercise.
Real-time insight
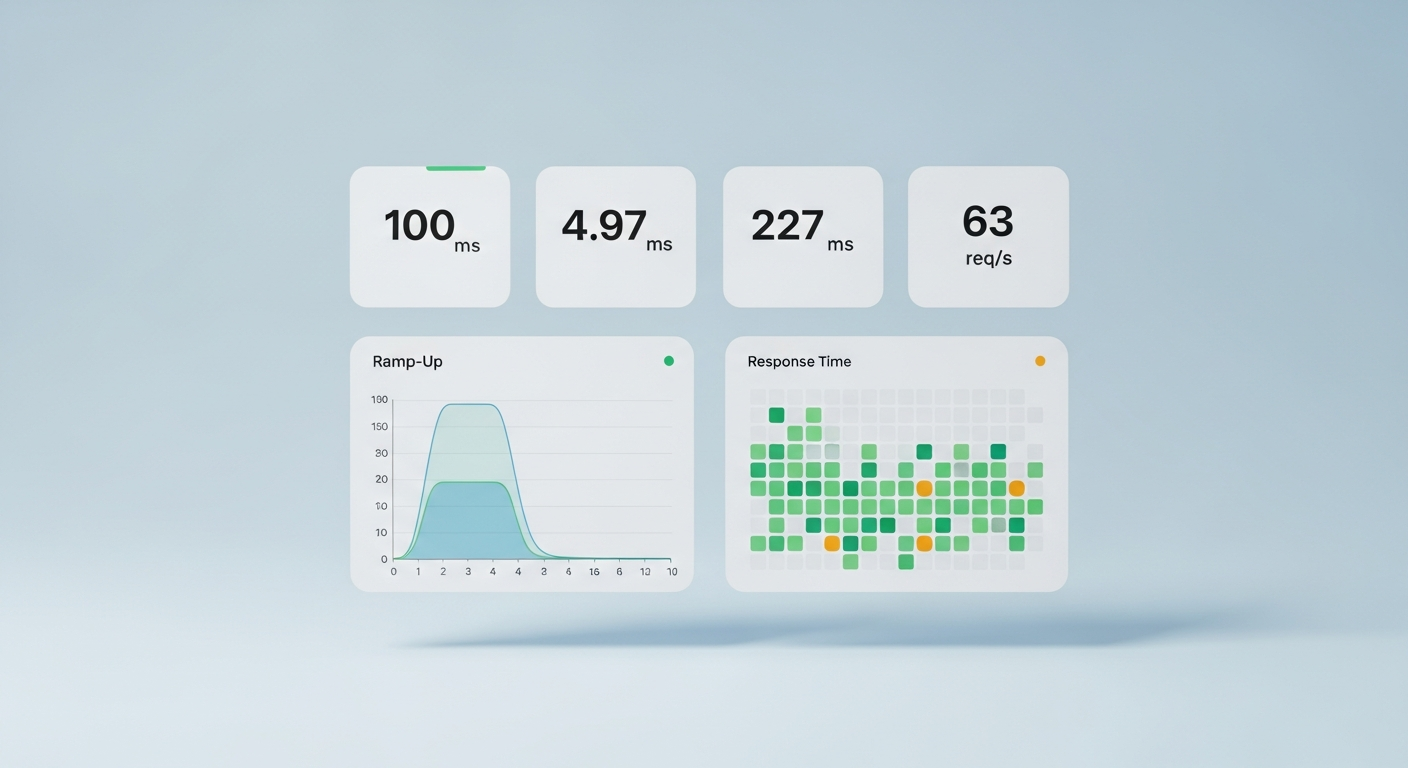
Stream metrics into Grafana or InfluxDB during the run. Spot the bottleneck while the test is still going, not in next week's report.
Best practices in K6
Use tags to slice your data
Tag requests by endpoint, journey, or release. Then filter the dashboard to find which slice broke the SLO.
http.get(`${BASE}/orders`, { tags: { endpoint: 'orders', journey: 'checkout' } });Thresholds as pass/fail gates
Codify your SLO inside the test. K6 exits non-zero when p95 slips, so a regression fails the pipeline.
export const options = {
  thresholds: {
    http_req_duration: ['p(95)<500'],
    http_req_failed:   ['rate<0.01'],
  },
};Scenarios over flat VUs
Model realistic load — ramping arrivals, constant rate, or per-user journeys — instead of a flat VU count that doesn't match production.
scenarios: {
  ramp: { executor: 'ramping-arrival-rate', startRate: 10, stages: [...] },
}Visualise in real time
Stream output into Grafana + InfluxDB or k6 Cloud. Watching the run live beats reading the JSON afterwards.
k6 run --out influxdb=http://localhost:8086/k6 script.jsI make sure industry best practices are applied in every K6 implementation. By leveraging custom thresholds, modular scripts, and real-time visualisation, I help ensure your systems can handle the demands of modern traffic loads with confidence.
Test automation reporting
K6 provides real-time metrics, integrates with monitoring solutions like Grafana and InfluxDB, and supports both local and cloud-based load testing. With its simple JavaScript scripting and powerful reporting capabilities, K6 helps ensure applications are robust and reliable under heavy load.
HTML reporter
Self-contained summary you can attach to a release ticket.
JSON output
Pipe raw metrics into anything — your data warehouse, Slack, or a custom dashboard.
Grafana + InfluxDB
PickReal-time graphs during the run, with retention for trend analysis.
k6 Cloud
Hosted dashboards, distributed runs, and historical comparison out of the box.
Use cases
K6 fits a range of performance testing needs. Below are real engagements where I have used K6 to help clients stay ahead of load issues.
- 01Client

Load testing APIs for Bynder
Bynder, a digital asset management platform, needed assurance that their upload APIs could handle thousands of transactions per second without failure. I implemented K6 to simulate high traffic loads, helping the team identify bottlenecks and optimise API performance — making the system more reliable under peak loads and ensuring smooth user experiences during high-traffic periods.
- 02
Stress testing a retail e-commerce platform
For a retail client gearing up for Black Friday, I used K6 to stress test their e-commerce platform, simulating thousands of users shopping and completing purchases simultaneously. K6 helped identify weak points in their infrastructure, allowing the client to scale resources before the sale event and avoid costly downtime.
- 03
Continuous performance monitoring in CI/CD
A SaaS company needed continuous performance monitoring integrated into their CI/CD pipeline and Grafana. I set up K6 to run performance tests automatically after each deployment, allowing the team to catch performance regressions early and ensuring every release maintained the high performance their customers expected.
Useful links
Ready to take the next step in K6?
With years of experience in test automation and tools like K6, I help businesses optimise their testing for faster, more reliable results. Get in touch to discuss how we can implement K6 for your team.